Angler Insights : Customer Insights
Who are your high value customers?
Context
Angler AI analyzes zero and first party data of its clients, in addition to its proprietary database about 251M+ US consumers (covering 98% of adults 18+ year olds in the country) to understand characteristics of high value customers for the client. The actionable insights from such analysis is then presented as Customer Insights.
Input Data
Customer Insights are powered by Angler's predicted LTV (pLTV) model, where we model repurchase revenue from customers after their latest order. The repurchase revenue is modeled typically 90-days in the future, however, the model can be configured for a shorter or longer repurchase window. Please contact [email protected] for this configuration change.
Key Questions
Customer Insights are designed to answer the key questions such as (a) who are high value customers, (b) how the client is acquiring them, (c) what are the characteristics of these high value customers through the lense of what products they purchase and don't purchase, how they purchase, when they purchase, which channel, activities are finding them, (d) economic opportunities by changing the mix of high value customers by just 1%, and how many high value prospects out there for the client to acquired, and (e) daily/weekly customer acquisition scorecards for high value customers acquired during the period.
Acquisition Time Window and Top Level Stats
The entire customer insights dashboard can be governed by acquisition time window; where one can look at the performance based on all new customers acquired in last 30, 60, 90, 180 and 365 days respectively. In this illustrative example below, the customer had acquired 42.3K customers in the most recent 365 days, those new customers are expected to generate $10.5M in their first year with the brand.

Angler Value Tiers
Angler is segmenting these customers into 3 buckets: high (top 20%), medium (next 30%) and low (bottom 50%), based on predicted repurchase revenue. 90-day and 1-year LTV by these value tiers demonstrate significant economic opportunities by changing the mix of high value tier customers by just 1%.

Angler Value Score
Angler value tiers are further segmented into Angler value scores 0-100, each score representing 1% of all new customers, ordered in terms of their 90-day predicted repurchase revenue. The chart represents 90-day and 1-year LTV, including first order value, across value scores.

Quality of Customers Acquired by Week
Next we analyze customer quality by acquisition week cohorts, thereby analyzing the quality of customers acquired (in terms of LTV) by acquisition week, and period over period changes to it. There are some seasonality aspects that drive customer LTV, and customers acquired through promotions during BFCM and holiday periods tends to capture the higher mix of one and dones customers.

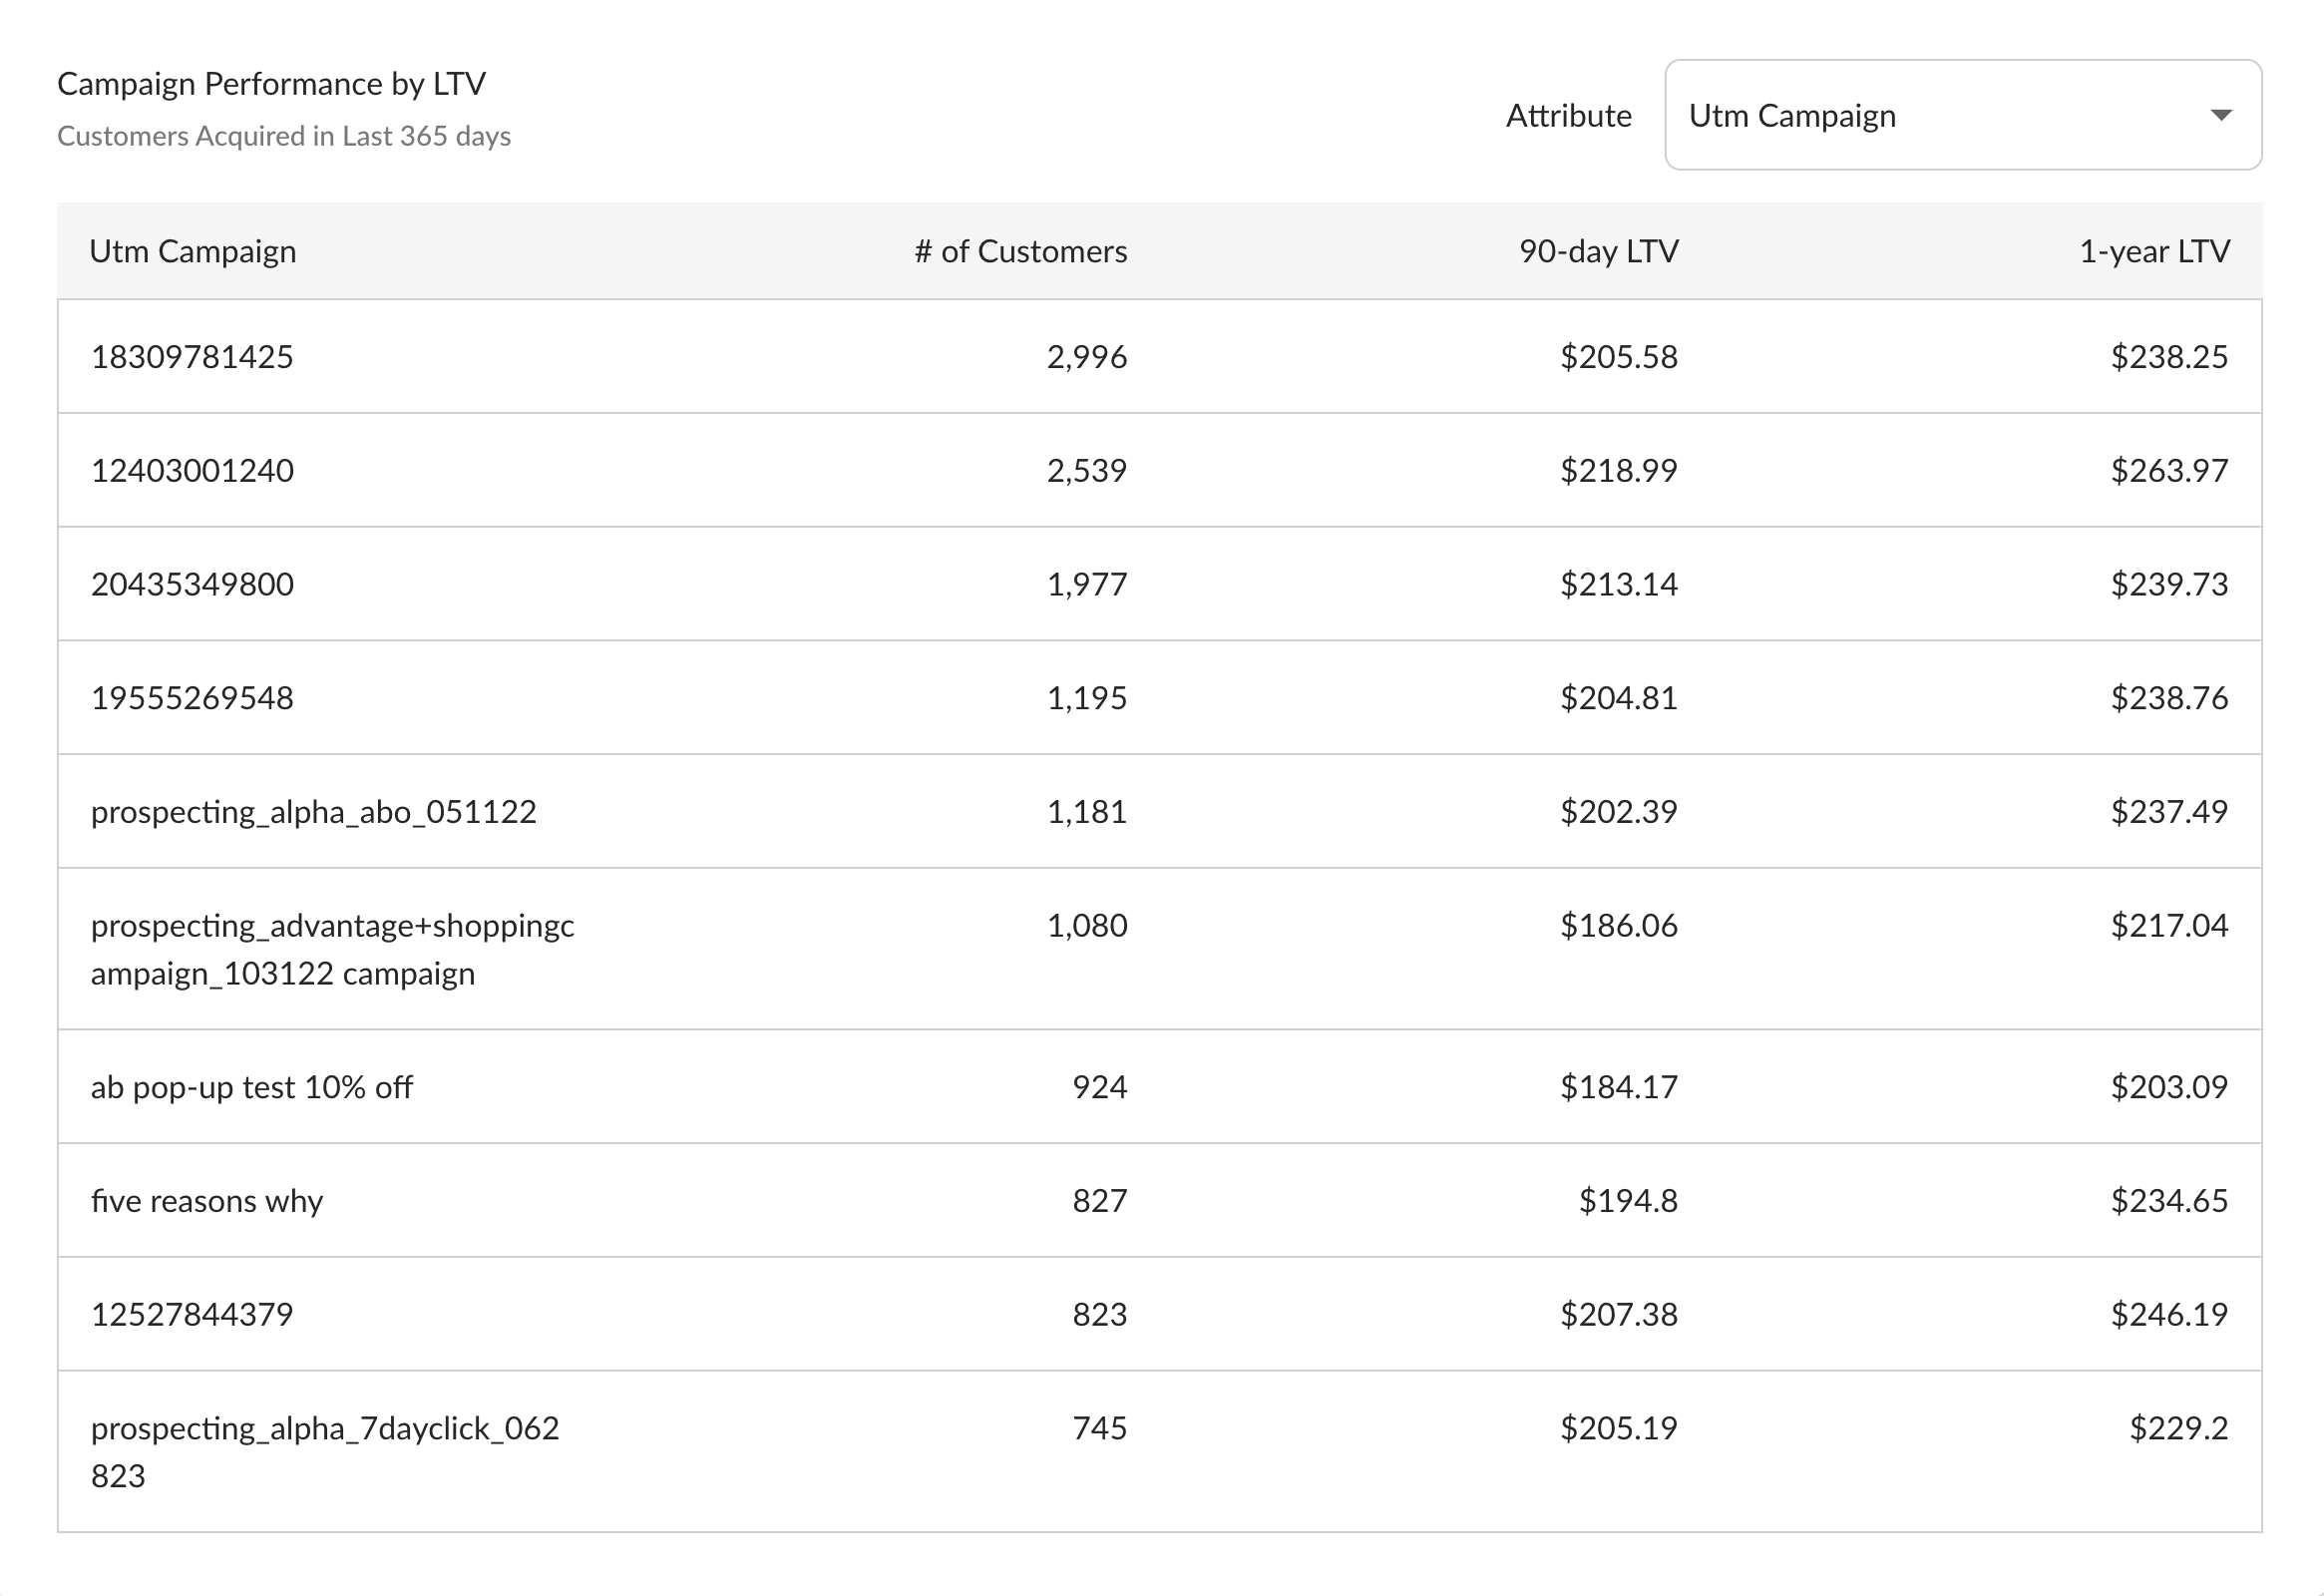
LTV Variances by Marketing Activities
Based on last touch attribution, clients can analyze various marketing activities and their relative efficacy in acquiring high LTV customers. The performances can be analyzed by top 5 UTM attributes (based on total customers coverage of UTM attribute groups). Performances are defined in terms of 90-day and 1-year LTV respectively. Marketers can identify activities (channels, campaigns, creatives, and ads) that are acquiring high value customers, use such information in future planning and scaling/pausing of existing campaigns.
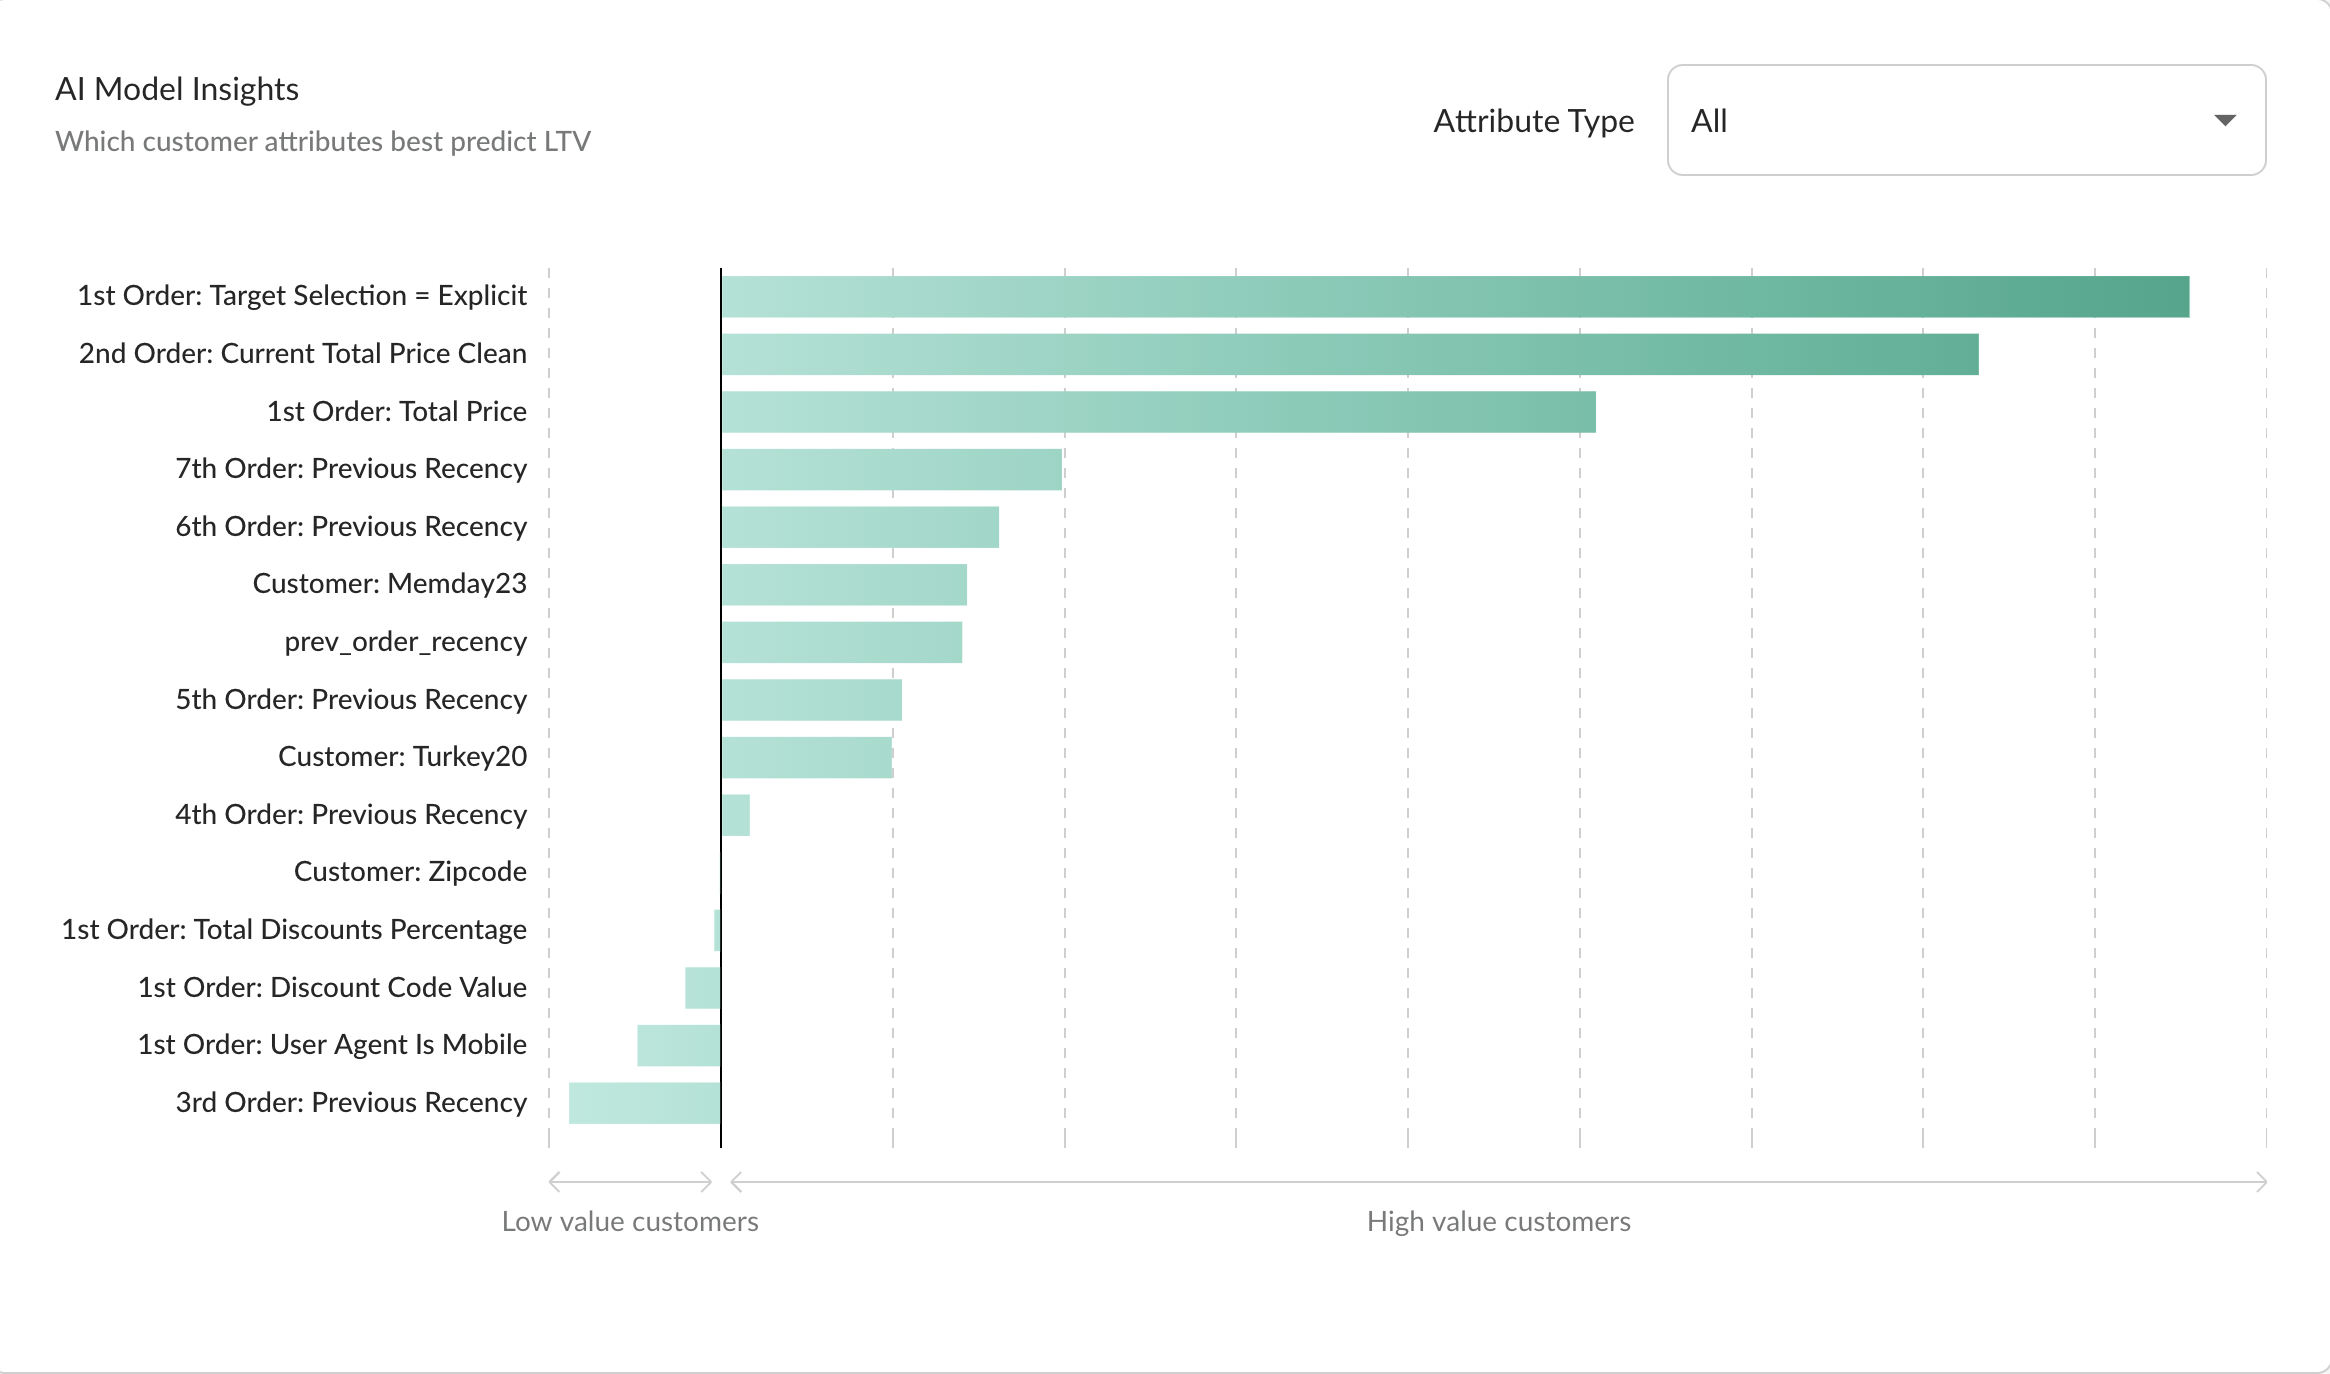
The Drivers of LTV
Lastly, Angler's predictive engine identifies the positive and the negative drivers of LTV: what are the traits of customers, what they purchase, how they purchase, when they purchase and so on, that makes then high value customers. Similarly, we also identify the traits that make customers low value, i.e. less likely to repurchase. The attributes are organized in the order of their impact to LTV: most favorable driver sits on the top, and most unfavorable driver is at the bottom. We list top 15 attributes. Furthermore, the user is able to focus on specific groups of attributes (features) such as product attributes only or customer attributes only, and the chart returns top 15 attributes within the attribute scope.
Updated 2 months ago